Covid-19 사회적 거리두기 측정
코로나19 이후, 즉 포스트 코로나(Post COVID-19) 시대의 세상은 지금과 완전히 다를 것입니다. 이미 각 국가의 고강도 사회적 거리두기 정책으로 인해 보금자리였던 집이 또 하나의 업무 공간으로 탈바꿈하였으며, 오프라인 사회에서 온라인 사회로, 나아가 디지털 사회로 전환하는 발판을 만들어 주었습니다.

COVID-19
소위 뉴-노멀이라는 새로운 세상에서 IT는 지금보다 더 큰 역할을 할 것으로 예상됩니다. 언택트(Untact) 문화의 확산, 온라인 소비의 증가, 온라인 교육 등의 생활이 일상화되는 움직임은 국가 간 경계를 뒤로 한 채 전 세계적인 디지털 전환을 가속화할 것이기 때문입니다.
언제 어느 순간 나타날지도 모르는, 어쩌면 이미 다가와 있는 상상 가능한 미래에 사전적으로 대비하기 위해서는 전세계의 많은 IT 기술자들이 정보를 공유하고 다양한 방식으로 참여하고 있습니다.
오늘날 불행히도 모든 사람들은 “사회적 거리” 라는 용어에 익숙합니다 . 모든 것이 정상으로 돌아올 때까지 우리는 잠시 동안 코로나 바이스러와 함께 살아야 할 것입니다.
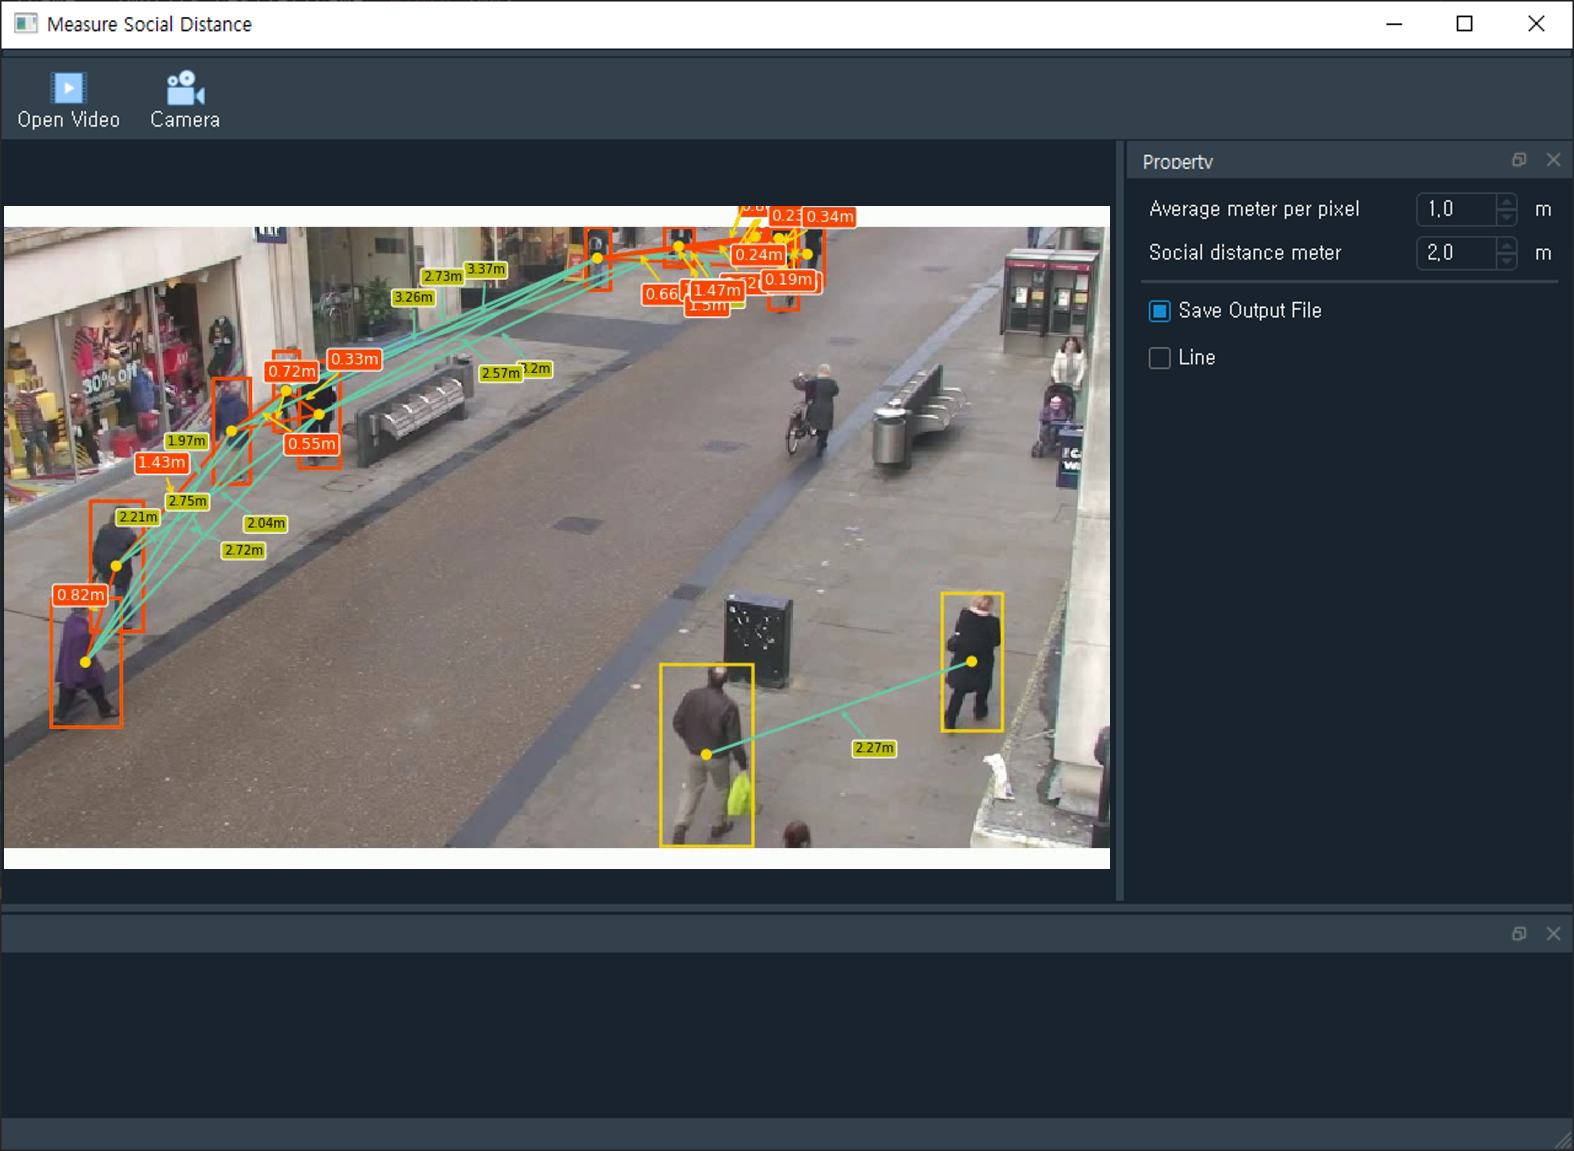
이번에는 Object Detection 을 이용하여 보행자 사이의 사회적 거리를 식별하고 측정하는 애플리케이션을 개발하려고 합니다 .
사람을 Detect 하기 위해서 YOLO object detector를 사용합니다.
labelsPath = os.path.sep.join([config.YOLO_MODEL_PATH, "coco.names"]) self.LABELS = open(labelsPath).read().strip().split("\n") weightsPath = os.path.sep.join([config.YOLO_MODEL_PATH, "yolov3.weights"]) configPath = os.path.sep.join([config.YOLO_MODEL_PATH, "yolov3.cfg"]) self.net = cv2.dnn.readNetFromDarknet(configPath, weightsPath) self.ln = self.net.getLayerNames() self.ln = [self.ln[i[0] - 1] for i in self.net.getUnconnectedOutLayers()] if config.USE_GPU: # CUDA Setting os.environ["CUDA_DEVICE_ORDER"] = "PCI_BUS_ID" os.environ["CUDA_VISIBLE_DEVICES"] = "0, 1, 2,3" self.net.setPreferableBackend(cv2.dnn.DNN_BACKEND_CUDA) self.net.setPreferableTarget(cv2.dnn.DNN_TARGET_CUDA)
1) YOLO objcect detector 를 이용하여 비디오 스트림에서 사람만을 감지합니다.
frame = cv2.cvtColor(frame, cv2.COLOR_BGR2RGB) results = detect_people(frame, self.net, self.ln, personIdx=self.LABELS.index("person"))
2) 추출된 사람들 사이의 거리를 계산합니다.
centroids = [] coordinates = [] # # Calculate normalized coordinates for boxes for (i, (prob, bbox, centroid)) in enumerate(results): coord = calculate_coord(bbox, i) centr = calculate_centr(coord) centroids.append(centr) coordinates.append(coord) permutations = calculate_perm(centroids) # Display boxes and centroids fig, ax = plt.subplots(figsize = (10,6), dpi = 90, frameon=False) ax = fig.add_axes([0, 0, 1, 1]) ax.axis('off') ax.spines['top'].set_visible(False) ax.spines['right'].set_visible(False) ax.spines['bottom'].set_visible(False) ax.spines['left'].set_visible(False) ax.get_xaxis().set_ticks([]) ax.get_yaxis().set_ticks([]) for coord, centr in zip(coordinates, centroids): ax.add_patch(patches.Rectangle((coord[0], coord[1]), coord[2], coord[3], linewidth=2, edgecolor='lime', facecolor='none', zorder=10)) ax.add_patch(patches.Circle((centr[0], centr[1]), 3, color='lime', zorder=20)) # Display lines between centroids for perm in permutations: dist = calculate_centr_distances(perm[0], perm[1]) dist_m = dist/self.sb_averagePxMeter.value() x1 = perm[0][0] y1 = perm[0][1] x2 = perm[1][0] y2 = perm[1][1] person_index1 = perm[0][2] person_index2 = perm[1][2] # Calculate middle point middle = midpoint(perm[0], perm[1]) # Calculate slope slope = calculate_slope(x1, y1, x2, y2) dy = math.sqrt(3**2/(slope**2+1)) dx = -slope*dy # Set random location if randrange(10) % 2== 0: Dx = middle[0] - dx*10 Dy = middle[1] - dy*10 else: Dx = middle[0] + dx*10 Dy = middle[1] + dy*10
3) 이 거리를 기반으로 사람들 거리가 특정 pixel 미만으로 떨어져 있는지 측정합니다.
if dist_m < self.sb_socialDistanceMeter.value(): if self.cb_line.isChecked(): ax.annotate("{}m".format(round(dist_m, 2)), xy=middle, color='white', xytext=(Dx, Dy), fontsize=10, arrowprops=dict(arrowstyle='->', lw=1.5, color='yellow'), bbox=dict(facecolor='red', edgecolor='white', boxstyle='round', pad=0.2), zorder=35) ax.plot((perm[0][0], perm[1][0]), (perm[0][1], perm[1][1]), linewidth=2, color='red', zorder=15) ax.add_patch(patches.Rectangle((coordinates[person_index1][0], coordinates[person_index1][1]), coordinates[person_index1][2], coordinates[person_index1][3], linewidth=2, edgecolor='r',facecolor='none', zorder=10)) ax.add_patch(patches.Rectangle((coordinates[person_index2][0], coordinates[person_index2][1]), coordinates[person_index2][2], coordinates[person_index2][3], linewidth=2, edgecolor='r', facecolor='none', zorder=10)) ax.add_patch(patches.Circle((centroids[person_index1][0], centroids[person_index1][1]), 3, color='red', zorder=20)) ax.add_patch(patches.Circle((centroids[person_index2][0], centroids[person_index2][1]), 3, color='red', zorder=20)) # cv2.line(frame, (int(x1), int(y1)), (int(x2), int(y2)), color=(255,0, 0), thickness=2) elif self.sb_socialDistanceMeter.value() < dist_m < self.sb_socialDistanceMeter.value() + 1.5: if self.cb_line.isChecked(): ax.annotate("{}m".format(round(dist_m, 2)), xy=middle, color='black', xytext=(Dx, Dy), fontsize=8, arrowprops=dict(arrowstyle='->', lw=1.5, color='skyblue'), bbox=dict(facecolor='y', edgecolor='white', boxstyle='round', pad=0.2), zorder=35) ax.plot((perm[0][0], perm[1][0]), (perm[0][1], perm[1][1]), linewidth=2, color='skyblue', zorder=15) else: pass
4) 단순히 pixel 이 아닌 실제 측정 가능한 단위로 계산 하도록 Bird’s eye view로 구현 합니다.

실제 개발은 2020년도에 했는데, 작성을 늦게 하네요. 이제와서 개발 소스코드를 보니 다소 깔끔하게 정리가 되지 않은 상태로 남아있네요. 당시에 UI를 포함하여 수정 할 수 있도록 만들었었습니다.

'Project' 카테고리의 다른 글
| Labeling Tool (UTTU) (2) | 2023.01.03 |
|---|---|
| 문서이해 Solution 개발 (VisionOCR) (0) | 2023.01.02 |
| Paperless Hospital - 서류관리 Mobile App 개발 (Android & Python) (0) | 2022.02.18 |
| EDS(Easy Data Sync) - Database Migration & Synchronization (0) | 2021.03.02 |
| Python을 활용한 마스크 자동 구매 프로그램 (0) | 2021.01.31 |
댓글을 사용할 수 없습니다.